rPraat and mPraat: Connect Praat, Matlab, and R

Read, write, create, and manipulate Sound, TextGrid, PitchTier, IntensityTier, Pitch, and Collection files from Praat in R and Matlab.
- Please, cite: Bořil, T., & Skarnitzl, R. (2016). Tools rPraat and mPraat. In P. Sojka, A. Horák, I. Kopeček, & K. Pala (Eds.), Text, Speech, and Dialogue (pp. 367–374). Springer International Publishing. Full text of the paper in pdf: DOI 10.1007/978-3-319-45510-5_42
- Bibtex: [bib]
- Full text of the paper in pdf (preprint draft version): rPraat, mPraat homepage
- Conference presentation: [pdf]
Highlights
- Transfer TextGrid, PitchTier, IntensityTier, Pitch files among Praat, Matlab, and R.
- Read, modify, write, and plot Praat TextGrid, PitchTier, IntensityTier and Pitch files in Matlab and R.
- Access TextGrid tiers by their names in scripts. No matter the phoneme tier is 1st of 4th, create universal scripts.
- Create interactive figure on your webpage.
- Process all files in folder.
- See rPraat demo webpage.
- See mPraat demo webpage.
- All tools are opensource, everyone can contribute
- For installation, source code, demonstration and references (including bibtex), please visit rPraat and mPraat homepage.
Abstract: The paper presents the rPraat package for R / mPraat toolbox for Matlab which constitutes an interface between the most popular software for phonetic analyses, Praat, and the two more general programmes. The package adds on to the functionality of Praat, it is shown to be superior in terms of processing speed to other tools, while maintaining the interconnection with the data structure of R and Matlab, which provides a wide range of subsequent processing possibilities. The use of the proposed tool is demonstrated on a comparison of real speech data with synthetic speech generated by means of dynamic unit selection.
^ACR method - Power spectral density approach to Granger causality in frequency domain in MATLAB (source code)

ACR - Autoregressive causal relation: Digital filtering approach to causality measures in frequency domain
By Tomáš Bořil, Pavel Sovka. Full text of the paper in pdf: Elsevier, Digital Signal Processing, 2013
Full text of the paper in pdf (preprint draft version): boril_sovka_2013_autoregressive_causal_relation.pdf
Download the source code of the ACR method and the experiment in Matlab/Octave for free
Please cite this article as
- Bořil, T., Sovka, P.: Autoregressive causal relation: Digital filtering approach to causality measures in frequency domain, Digital Signal Processing Vol. 23 (2013), Issue 5, pp. 1756-1766, DOI: 10.1016/j.dsp.2013.04.006.
- Bibtex: [bib]
Highlights
- Problem of causal relations in frequency domain among time series is studied.
- A novel measure for evaluation of causal relations is suggested.
- Unlike existing methods, it is based on systematic use of power spectral density.
- It decomposes diagonal elements of a spectral matrix in direct causal route.
- The advantage is the direct physical interpretation of the strength of relations.
Abstract: A novel measure of the Autoregressive Causal Relation based on a multivariate autoregressive model is proposed. It reveals the strength of the connections among a simultaneous time series and also the direction of the information flow. It is defined in the frequency domain, similar to the formerly published methods such as: Directed Transfer Function, Direct Directed Transfer Function, Partial Directed Coherence, and Generalized Partial Directed Coherence. Compared to the Granger causality concept, frequency decomposition extends the possibility to reveal the frequency rhythms participating on the information flow in causal relations.
The Autoregressive Causal Relation decomposes diagonal elements of a spectral matrix and enables a user to distinguish between direct and indirect causal relations. The main advantage lies in its definition using power spectral densities, thus allowing for a clear interpretation of strength of causal relation in meaningful physical terms.
The causal measures can be used in neuroscience applications like the analysis of underlying structures of brain connectivity in neural multichannel time series during different tasks measured via electroencephalography or functional magnetic resonance imaging, or other areas using the multivariate autoregressive models for causality modeling like econometrics or atmospheric physics but this paper is focused on theoretical aspects and model data examples in order to illustrate a behavior of methods in known situations.
^Řeč - spolupráce s Hynkem Bořilem (2005)
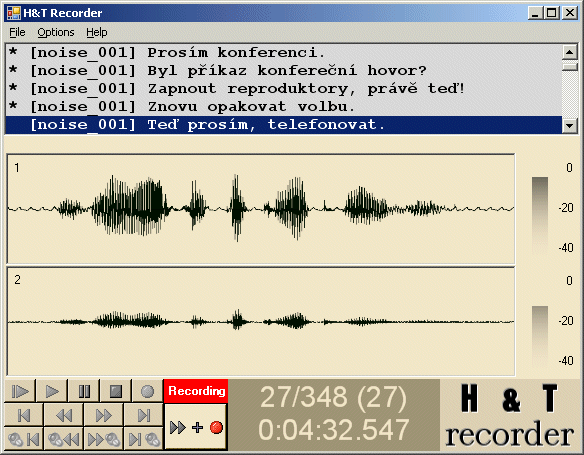
Pro potřeby nahrávání řečové databáze s Lombardovým efektem jsem vytvořil program H&T Recorder, pracující pod platformou .Net a knihovnou DirectX.

 Česky
Česky  English